The Opposite of Forecasting
June 3rd, 2018 at the Museum of Human Achievement
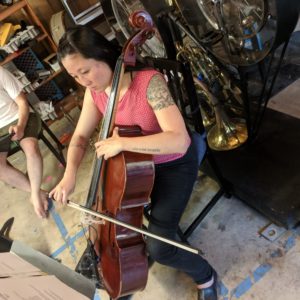
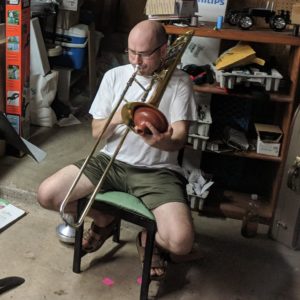
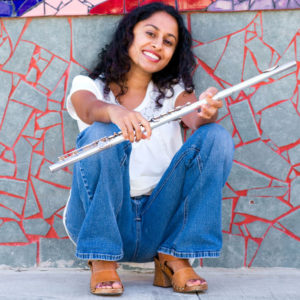
- Performers for 2pm Set: Sarah Brown, Chris Demetriou, and Spencer Johnson
- Performers for 4pm Set: Tiago da Silva, Laura Dykes, and Seetha Shivaswamy
- Performers for 6pm Set: Henna Chou, Steve Parker, and Alan Retamozo
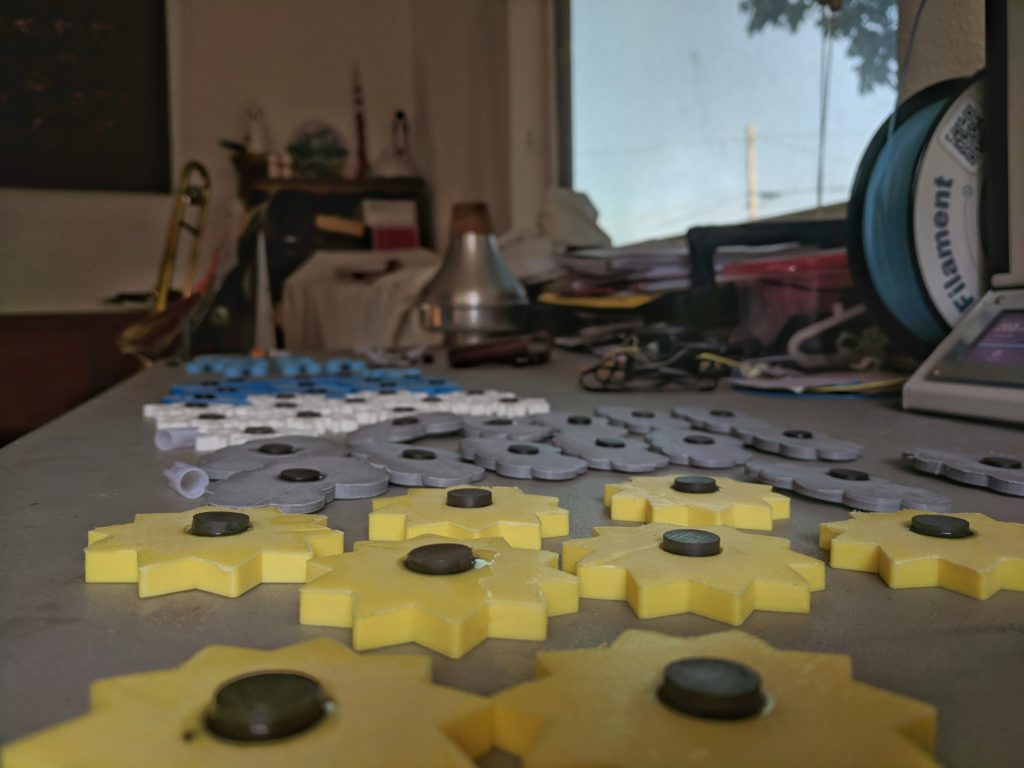
Last summer, I built an installation that used umbrellas hanging from a tower. People could move the umbrellas around and trigger different sounds. I spent the summer outside testing it out, which is not the most typical place for writing music and testing electronics. My attention moved to thinking about the weather around me and how it would change as the day went on. I’m really interested in these sorts of trivial every day occurrences that we often take for granted. It’s both obvious and interesting how I could feel the passage of time by noticing how the sun would feel on my skin over the course of the day. I started thinking about how I could translate this change into sound. Over the fall, I started grabbing weather data from the internet and used it to create music inside a programming language called SuperCollider.
This spring, I installed a weather data to collect the data myself. I’ve also been sharing the data with Weather Underground as an act of citizen science. The data is collected by a raspberry pi, which is also synthesizing the sound and broadcasting the resulting sounds to the Internet. The music you hear is based on the current temperature, humidity, rainfall, wind angle, wind speed, barometric pressure, UV, solar radiation, and PM 2.5 (particulate matter less than 2.5 micrometers).
Then again, the piece isn’t entirely about the weather. It’s much more about being present and aware of your surroundings. The sonfication of the weather is just an illustration of what is going on around us all the time.
For the live performances, the musicians will be improvising along with the electronic piece by following text prompts that focus their attention to different parts of the weather and charts of the weather data. For example, they may be asked to note the way the clouds look in the sky and use that image to inform what they play. The weather data charts will be used to organize how the musicians interact with each other.


