I got a lot of feedback expressing an interest in how the weather data was translated into music. Truthfully, the only reason I did not post this earlier is because I wasn’t sure how to tackle it without getting overly technically. I wasn’t trying to overwhelm people with minutia.
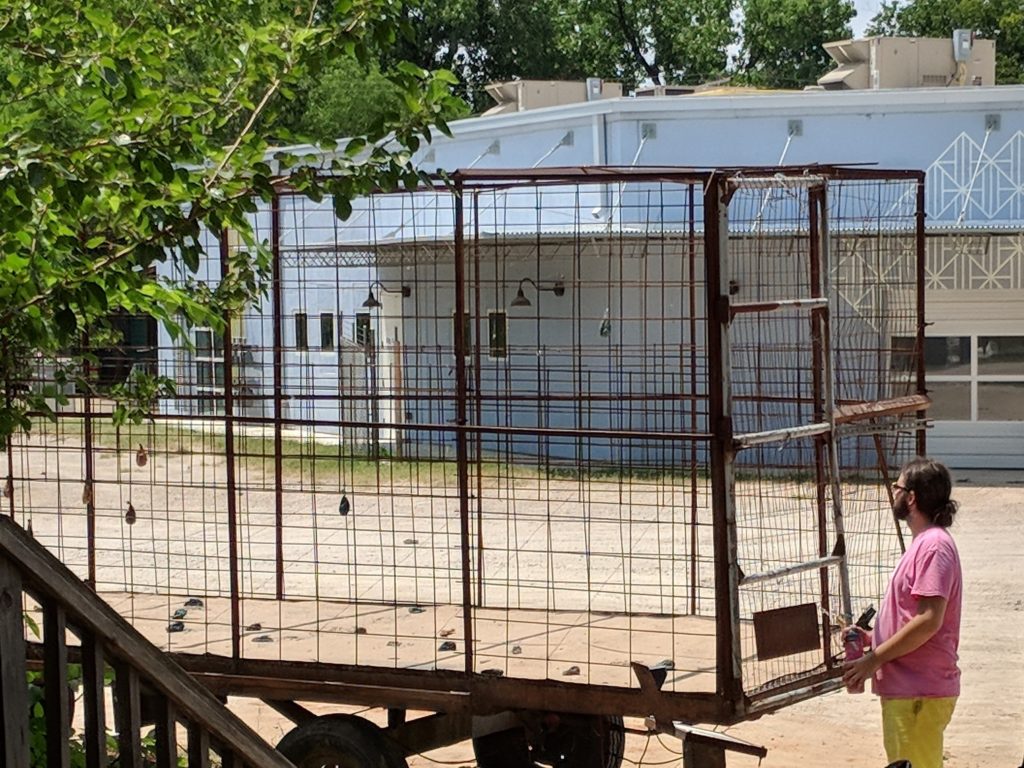
Not my cat.
But, since so many people asked, I figured I’d give it a shot anyhow. So, turn on the feed and read below.
The weather conditions monitored are temperature, humidity, atmospheric pressure, wind angle, wind speed, solar radiation, UV, and PM 2.5 (particulate matter smaller than 2.5 micrometers in diameter). There are currently about 30 different sounds in the piece. At least a couple weather parameters connect to each one, and there are also some weather conditions that affect all of the sounds you hear.
Globally, the piece’s tempo is determined by humidity. The more humid it is, the slower the piece.
The pitches played by the instruments are determined by looking at changes in atmospheric pressure. Pressure can be a good indicator of how the weather may change. For example, when the pressure lowers, more clouds roll in and it increases the chance of rain. Similarly, if pressure is lowering, the pitch set moves towards more minor pitch sets. If the pressure increases, it’ll move towards major modes.
The tuning of the piece is decided by PM2.5. If there’s a lot of dust, pollen, and pollution in the air, the piece will become less tuned. In perfect conditions, the tuning is basically pure intonation. If it gets bad out, it moves towards equal temperament, and if it’s really bad out, it’ll sound like that piano that hasn’t been tuned since you stopped taking lessons 25 years ago.
If it rains, a few things happen. The frequency range will be crunched, making the music sound something like an old telephone. Also, all of the audio is run through a delay and distortion effect. These aren’t extreme effects, but noticeable. Overall, the music will sound much more labored and distant.
A few special things happen to the percussion instruments, which are in a lot of ways the engine for the music. If the UV is very high, first of all put on some sun screen. Also, the percussion instruments will have some noticeable digital distortion added to them. If it gets very windy out, the percussion instruments will have a bit of a wobble added to them. More specifically, their volume will oscillate from beat to beat.
How percussion instruments are chosen to play is based on the temperature. After extensive google searching, it was determined that the ideal temperature is 71 degrees. At this temperature, the number of percussion instruments is at its peak. Above or below this, and fewer will play. Over the winter, you’ll hear very few percussion instruments. Which percussion instruments are playing is randomized, but anchored to the time of day. The code chooses an instrument at random based on a range it determines based on what time it is. There are more bass instruments playing at night and more metallic and click-y instruments during the day, but its possible to hear a variety at all times.
All of the percussion instruments have different variables, but the way they play all adapts to either humidity, wind speed, or both. Higher values generally means more of for that instrument. Maybe its the length of the notes, the volume at its attach, the amount of notes they play, etc. New percussion instruments are queued up every minute or so, if more need to be playing.
The melodic instruments are chosen based on wind direction. MoHA’s prevailing winds are South. When the wind direction moves further away from its normal direction, busier melodies play. This felt natural because it was a more novel occurrence. All of the melodic instruments behave very differently. For example, the bass instrument is playing Morse code rhythms and randomized pitches. The Morse code is of words people gave me that connected to their favorite weather words. Another simply plays 3 notes. The first two correspond to the weather conditions the last time it played. The third note indicates the current condition. Other factors relate to solar radiation and humidity. A new melody will be queued up roughly every 10 minutes.
Finally, the drones that play are reflection of solar radiation. They are ordered by how dissonant they sound. As the sun comes up, the piece will cycle through increasingly dissonant sounding drones. Other factors in the drones relate to wind speed and pressure. A new drone is queued up every 45 or 90 minutes, depending on how much the wind is blowing.
I think that’s about it! If I didn’t answer any of your questions, please send me a message at douglas.laustsen@gmail.com. Hopefully I can answer it!
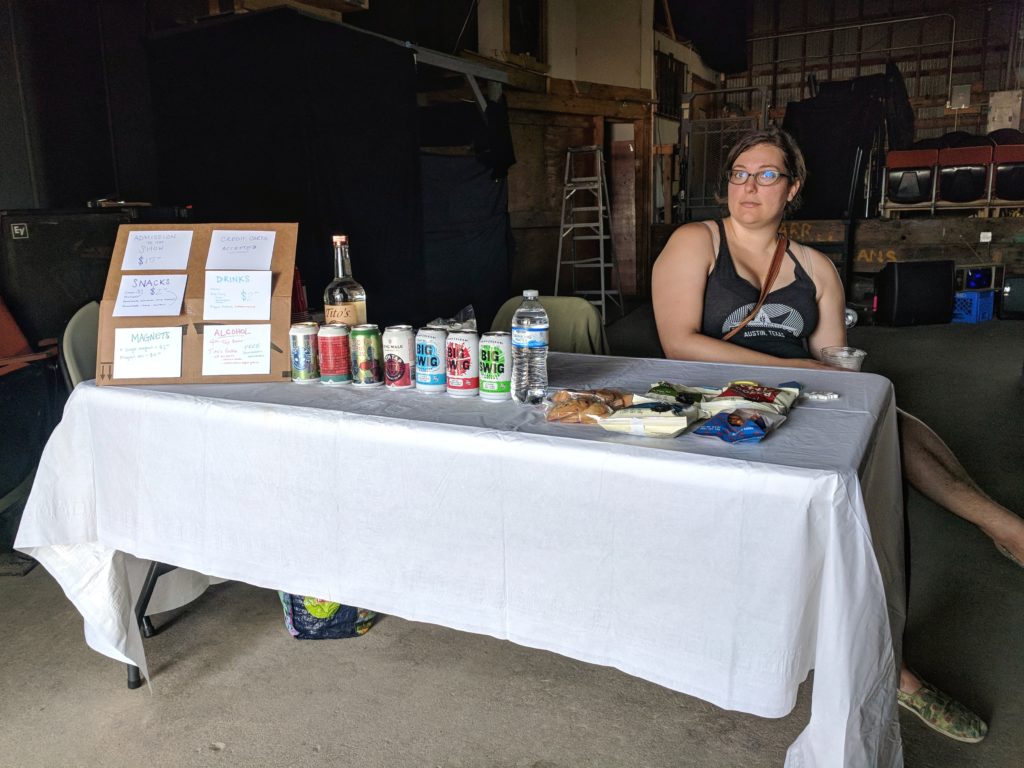
First of all, I want to express so much gratitude to everyone who contributed to the project. Thanks to you, everyone involved in the project will be able to be paid for their work. Specifically, thanks to out to Caitlyn Brown, Eric Imhof, Eileen Calabro, Justin Bulava, Skylar Buettner, Mohini Tellakat, Despina Lambros, Leta Moser, Lee Koontz, and Alex Rigney.
The indiegogo page may indicate that we only got to 65% of our goal, but the reality is that we managed to hit our goal with a little room to spare. We needed much less to hit our budget goal than indiegogo would allow. So, I’m really excited and relieved.
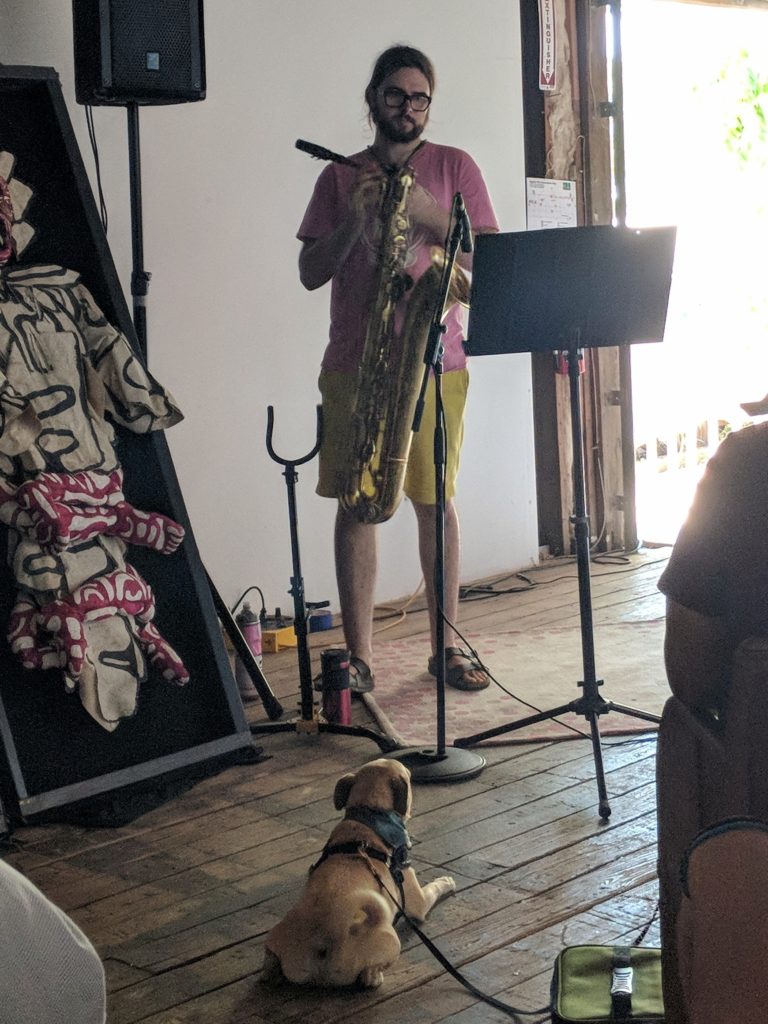
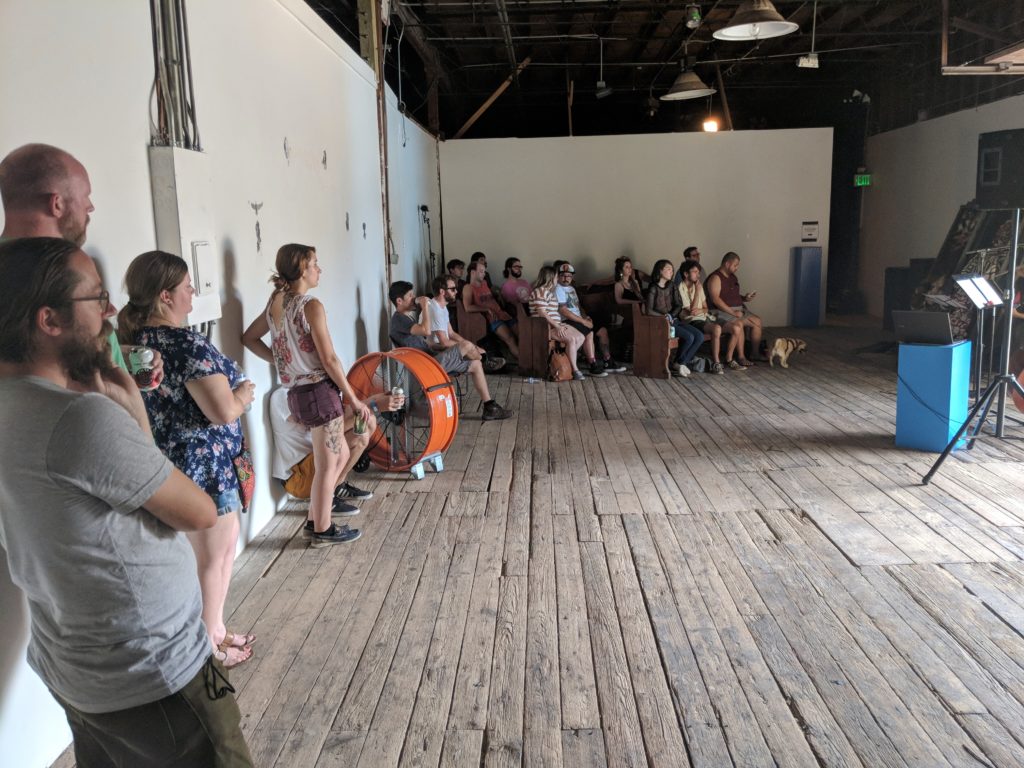
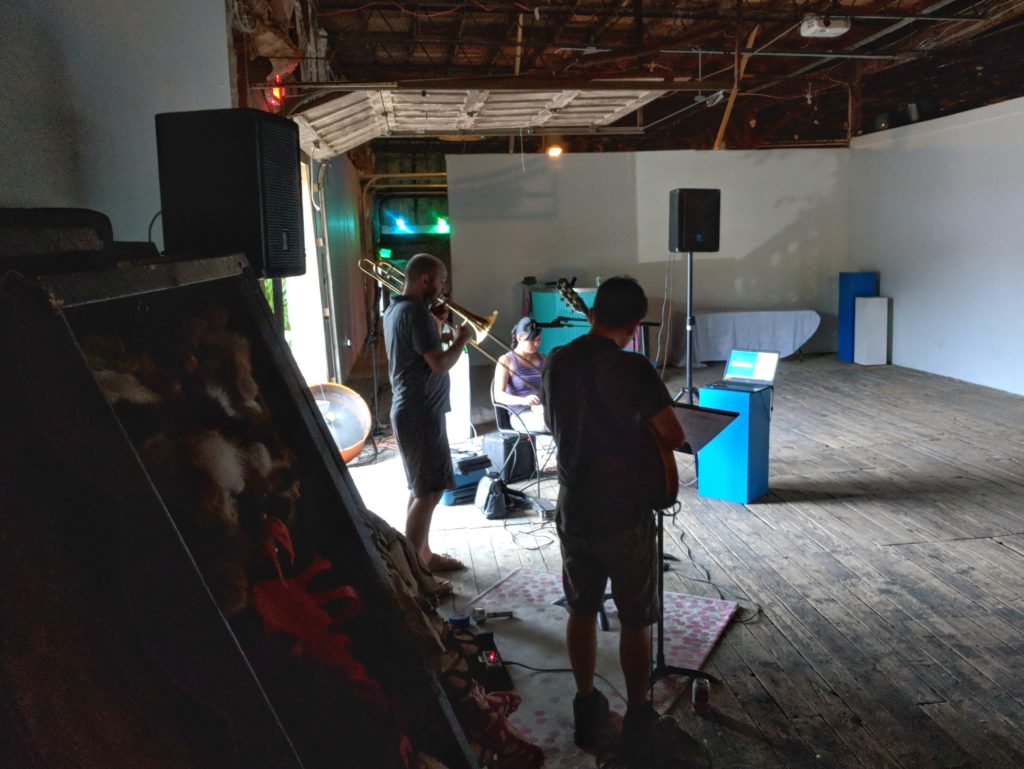
Also, I really cannot describe how grateful I was for everyone that toughed it out in 102 degree sauna that was MoHA on Sunday. It means so much to me that people were able to go through more than a little discomfort to listen to the musicians who performed in pretty unbearable conditions.
I would also be remiss if I did not also mention the thanks of all the other people who have contributed to the project. This includes the city of Austin Cultural Arts Division, 4th Tap Brewing Co-Op, and Tito’s Vodka. They’re a late addition to our sponsor page, but we were very excited to have them on board.
Finally, I want to thank all of the performers who joined me on this project. This includes Sarah Brown, Chris Demetriou, Spencer Johnson, Seetha Shivaswamy, Laura Dykes, Tiago da Silva, Henna Chou, Steve Parker, and Alan Retamozo. I also never would have been able to make this happen without the help and support of my wife Ana Rigney. Her assistance could be found every step of the way.
Thanks again to everyone! I hope you enjoyed it. The live stream will hopefully be live through June, assuming it doesn’t crash while I’m in Europe for a few weeks. After that I’ll be looking for another home for the weather station, possibly locally or regionally.
Performers for 2pm Set: Sarah Brown, Chris Demetriou, and Spencer Johnson
Performers for 4pm Set: Tiago da Silva, Laura Dykes, and Seetha Shivaswamy
Performers for 6pm Set: Henna Chou, Steve Parker, and Alan Retamozo
Last summer, I built an installation that used umbrellas hanging from a tower. People could move the umbrellas around and trigger different sounds. I spent the summer outside testing it out, which is not the most typical place for writing music and testing electronics. My attention moved to thinking about the weather around me and how it would change as the day went on. I’m really interested in these sorts of trivial every day occurrences that we often take for granted. It’s both obvious and interesting how I could feel the passage of time by noticing how the sun would feel on my skin over the course of the day. I started thinking about how I could translate this change into sound. Over the fall, I started grabbing weather data from the internet and used it to create music inside a programming language called SuperCollider.
This spring, I installed a weather data to collect the data myself. I’ve also been sharing the data with Weather Underground as an act of citizen science. The data is collected by a raspberry pi, which is also synthesizing the sound and broadcasting the resulting sounds to the Internet. The music you hear is based on the current temperature, humidity, rainfall, wind angle, wind speed, barometric pressure, UV, solar radiation, and PM 2.5 (particulate matter less than 2.5 micrometers).
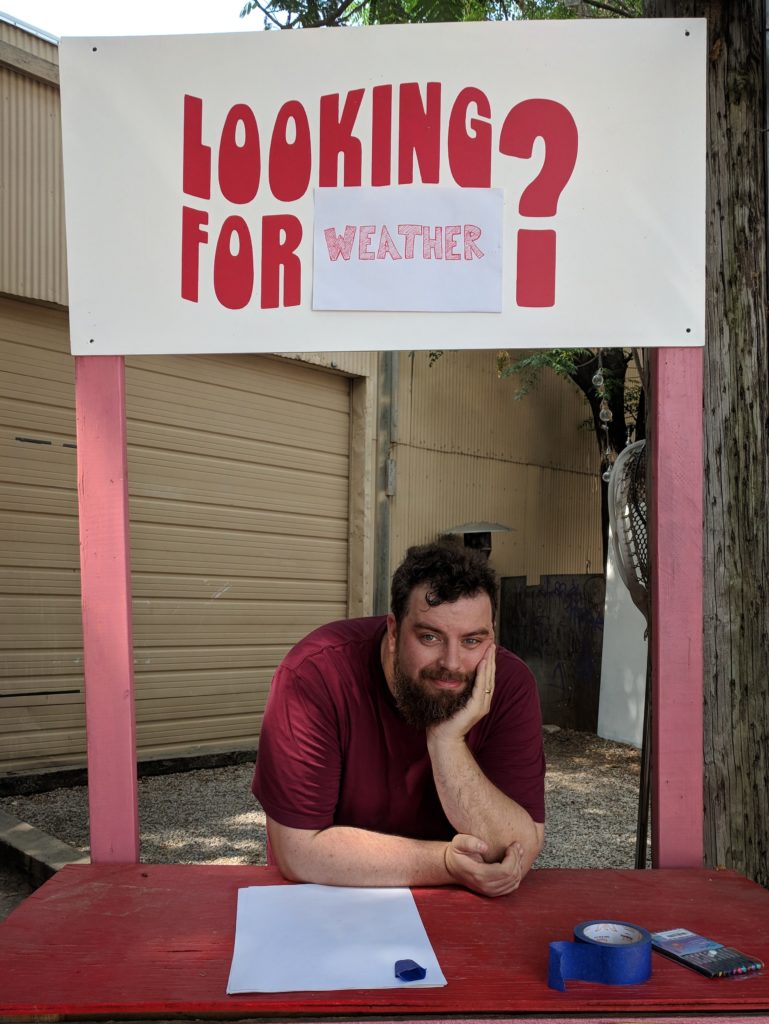
Then again, the piece isn’t entirely about the weather. It’s much more about being present and aware of your surroundings. The sonfication of the weather is just an illustration of what is going on around us all the time.
For the live performances, the musicians will be improvising along with the electronic piece by following text prompts that focus their attention to different parts of the weather and charts of the weather data. For example, they may be asked to note the way the clouds look in the sky and use that image to inform what they play. The weather data charts will be used to organize how the musicians interact with each other.
Even after the performance, you can listen in to the city’s weather at weather.lownote.net